
Gobble, Gobble: Stinson Eats Up Arc-Com
The recent acquisition may lack the cannibalistic drama of Pac-Man, but it does portend some interesting realignment in contract textiles. The new entity is almost certain to be more formidable then either brand alone—a sea-change that will affect the relative standing of the top-10-most-specified contract textile brands, revealing trends that would be harder to see across a much larger field. While this group doesn’t capture the entire market, it certainly reflects the bulk of it.*
A Snap Shot of the Field
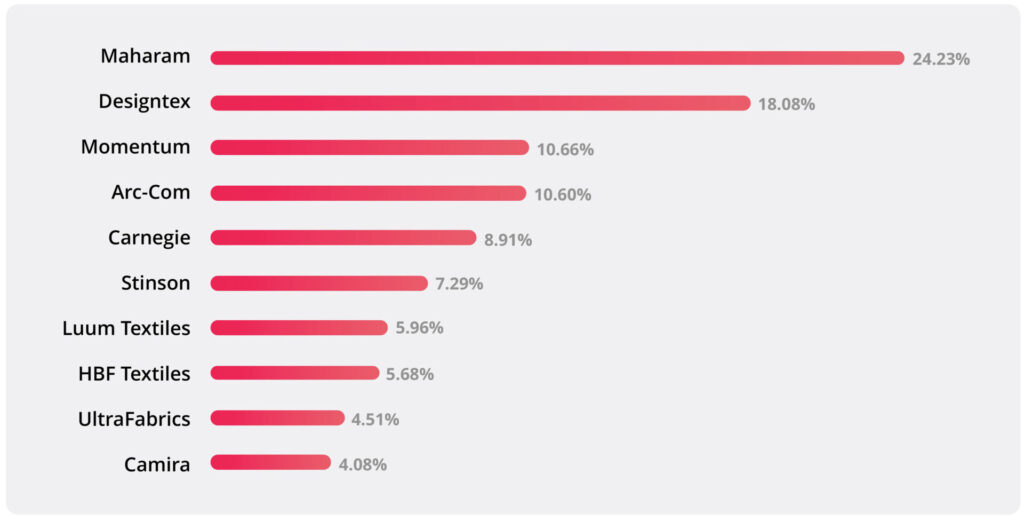
Over the past three years, these are the brands that show up most consistently as contract textile specifications (7,983 to be precise) on Designer Pages PRO, giving us a clear view of historical market dynamics within this category.
Top 10 Textile Brands by Total Market Share (Jul 2022 – Jun 2025)
Percentages reflect share of total specs within this peer set, not the broader market.
Losing the Thread
Stinson‘s recent acquisition of Arc-Com capped off a turbulent stretch for the latter, a period of financial strain that, by most accounts, came dangerously close to requiring a strategic rescue. But the data reveals a more nuanced story about subtle gains, shifting ranks, and long-term positioning.
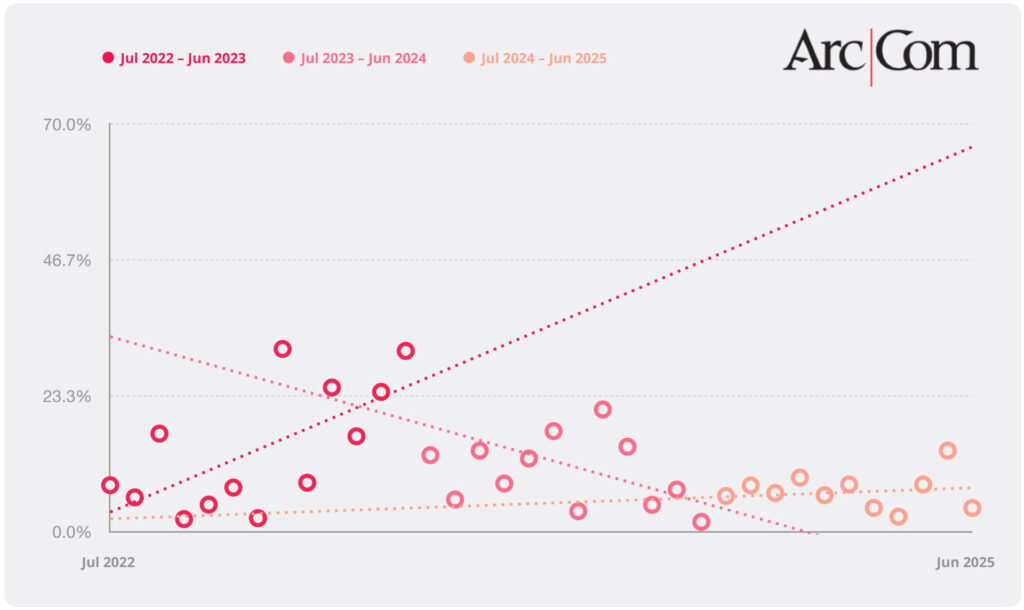
Between July 2023 and June 2024, Arc-Com’s market share dropped sharply, charting the steepest downward slope (-0.0087) of any top 10 brand that year. While we can’t say for certain why, activity on Designer Pages PRO revealed a striking pattern: several of Arc-Com’s most viewed, contacted, and specified sales representatives disappeared from firms’ directories within a short window of time. This sudden turnover suggests a shakeup in their sales force, one that likely figured in the decline. Dare we say… self-inflicted?
Arc-Com Specification Trends by Year — Designer Pages PRO
The Relationship Rule
Arc-Com may be an extreme case, but it underscores a broader truth we’re hearing across the industry. We recently surveyed 100 of the most active specifiers on Designer Pages PRO, and one clear theme emerged: this industry is still overwhelmingly driven by relationships. It’s easy to take that for granted, but the data made it plain: 73% of specifiers said they turn to their sales reps when researching products and 57% said they still rely on reps to get samples, even in the age of Material Bank. In this context, Arc-Com’s sudden decline may serve a reminder of how costly it can be to underestimate the role of relationships, especially regarding a brand’s first-line emissaries to the design community (read: sales force). View the complete survey findings.
Where One Story Ends…
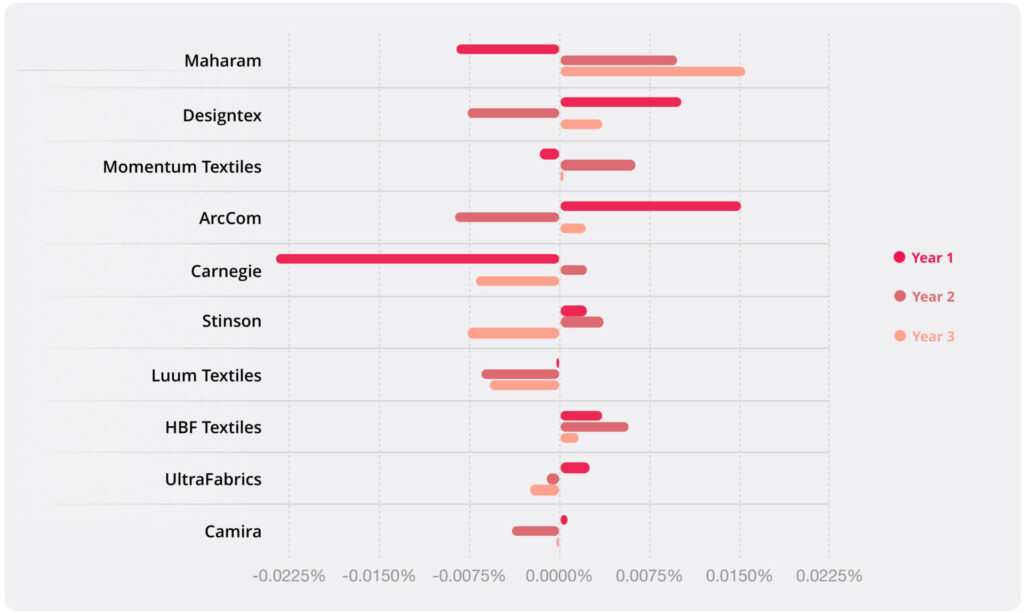
While Arc-Com faltered, consistent leader Maharam appeared to benefit most, posting the strongest upward slope of +0.0098, a clear sign of strengthening position during that period. Momentum and HBF also saw meaningful gains, with upward slopes of +0.0063 and +0.0058 respectively, ostensibly gobbling up the opportunity squandered by Arc-Com. Stinson, too, capitalized on this shifting landscape with a +0.0037 slope, reinforcing its trajectory as a brand quietly gaining share in the background.
Three-Year Trendline Slopes for Top 10 Textile Brands
Arc-Com Rebounds. Stinson Takes a Hit.
The following year (July 2024 through June 2025), Arc-Com showed signs of stabilization (+0.0022 slope—the third-highest among the group during this period), but it appears as though the damage had already been done, perhaps permanently altering their market position. Ironically, Stinson softened during that same period (-0.0076 slope), hinting that Arc-Com’s late-stage recovery may have come partially at their future owner’s expense. Maharam, meanwhile, again posted the strongest gain (an impressive .0154 slope), while Designtex, HBF, and Momentum trended upward during the period as well.
Over the full three-years, Arc-Com managed to hold onto the #4 position overall—but just barely— slipping to #5 in the final pre-acquisition year. Stinson, meanwhile, nearly doubled its market share, rising from 5.86% in Jul 2022–Jun 2023 to 9.24% in Jul 2024–Jun 2025—a 58% increase that vaulted Stinson up from #7 to #4, underscoring how incremental gains over a relatively short time can have an outsized impact on a crowded leader board.
One thing we couldn’t help but notice — beyond Arc-Com, Carnegie showed the steepest three-year decline of any other top brand. Maybe a story for another day… but let’s just say, if we were Carnegie, we’d be paying close attention.
Dismissing, for the time being, the implications of Arc-Com having become vulnerable to acquisition, we’d like to point out a hypothetical: as a single entity, Arc-Com and Stinson would have combined for a 17.89% market share during this three-year period, ranking them as the #3 player overall, ahead of Momentum (10.66%) and trailing only Maharam (24.23%) and Designtex (18.08%). Will Stinson + Arc-Com perform this well in the near future? The jury’s out, yet our hypothetical offers a potent reminder that the sum may indeed be greater than its parts: arguably, Arc-Com and Stinson now represent a formidable force near the top of the market.
What’s Next? Product Portfolios + Perception = Market Position
The competitive landscape in this segment has long been defined by distinct brand archetypes— shaped as much by the depth and makeup of their product portfolios (and of course their reputation) as by total market share. Recognizing that brand performance is fluid and comprised of multiple elements, many of which are intangible, here’s an attempt to strip this down to bare bones: We asked for a succinct summary of each brand’s market role (Is it pushing things to infer this as their “character”?), based solely on data in the chart below. If you buy that AI may occasionally be a viable surrogate for widespread human opinion, then this is the data speaking alone—no personal opinions, industry perceptions, showroom presence, or marketing claims muddying the waters.
The graphic below shows metrics relative to product performance within each brand, including ChatGPT’s assessment (“Brand Role”), #of products appearing in the top 500, Avg. Rank, Avg. Spec Share, Rank of the brand’s best-performing product, and lastly the spec share of the top product of each brand.
Top 10 Textile Brands — Ranked by Top 500 Product Performance
All metrics reflect data from the top 500 performing products

Sizing Up the Real Competition
We’re not sure that “Breadth Player with Modest Impact” is especially complementary for the #4 ranked Arc-Com, although the assessment may be truer than the artificial intelligence could know. If we add in ChatGPT’s take on Stinson as “Mid-Sized Contributor with Solid Bench,” we’re left with something along the lines of “Large-Sized Contributor.” In this case, acquiring the breadth inherent in Arc-Com’s portfolio may play out as appreciably tactical.
It’s no surprise that Maharam and Designtex remain the market’s diversified powerhouses (offering both “scale” and “depth” according to ChatGPT). Maharam’s prominence is reflected in the standout “Messenger” and “Meld” patterns (tied at #1 performing product with a .72% spec share), while Designtex’s top performer is the versatile Linnen (#5 at .47%). Versatile, subtly textured staples that flex across project types, these patterns evince their brands’ consistent performance—pairing design credibility with broad, practical reach. Together, Maharam and Designtex account for 231 of the top 500 textile products, with Maharam showing an average rank of 225 and average spec share of 0.11%, and Designtex at 186 and 0.11%, respectively.
The Top-Specified Product. Maharam’s Messenger showcases the brand’s habitual formula of quality + versatility.
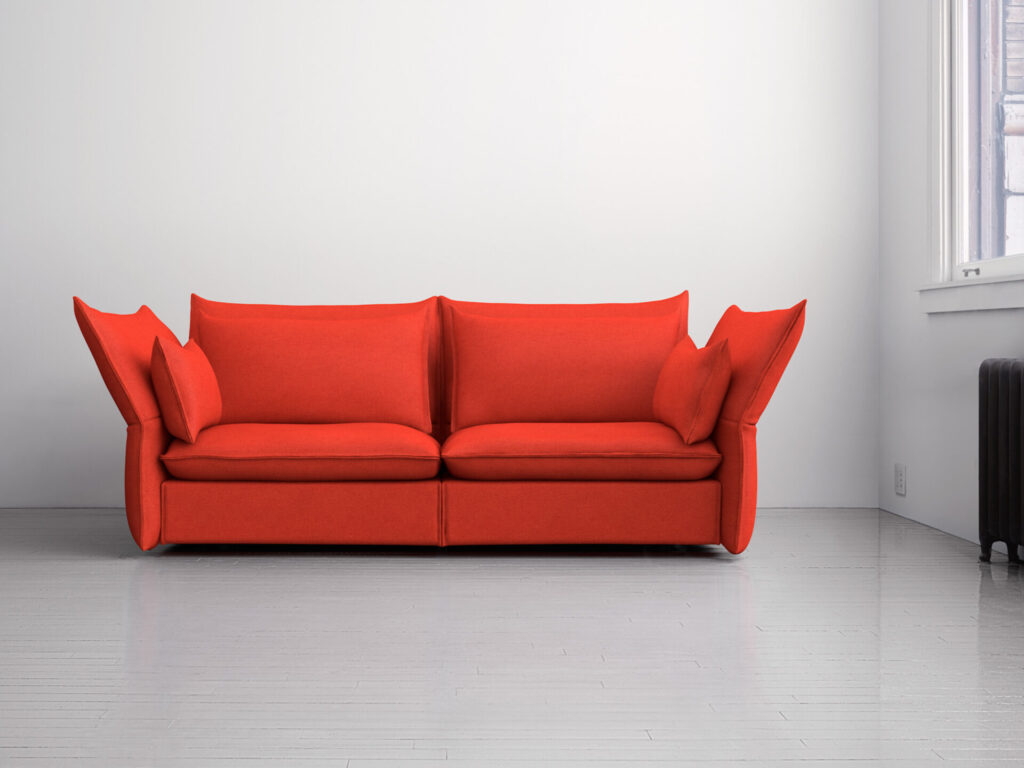
#3 Momentum has long been a breadth-first brand—a steady presence with wide-ranging market coverage. ChatGPT calls the brand a “Reliable Workhorse with a Broad Portfolio,” which seems to fit. Their top-performing product, the #31 ranked Canter, is a coated textile that aims for utility and broad use, rather than standout aesthetics. Canter is representative of Momentum’s historic performance, which has always been about depth over peaks, reflected in an average product rank of 268 and an average spec share of .08%.
Stinson and Arc-Com—a Pairing that Fills Gaps, not yet Big Shoes
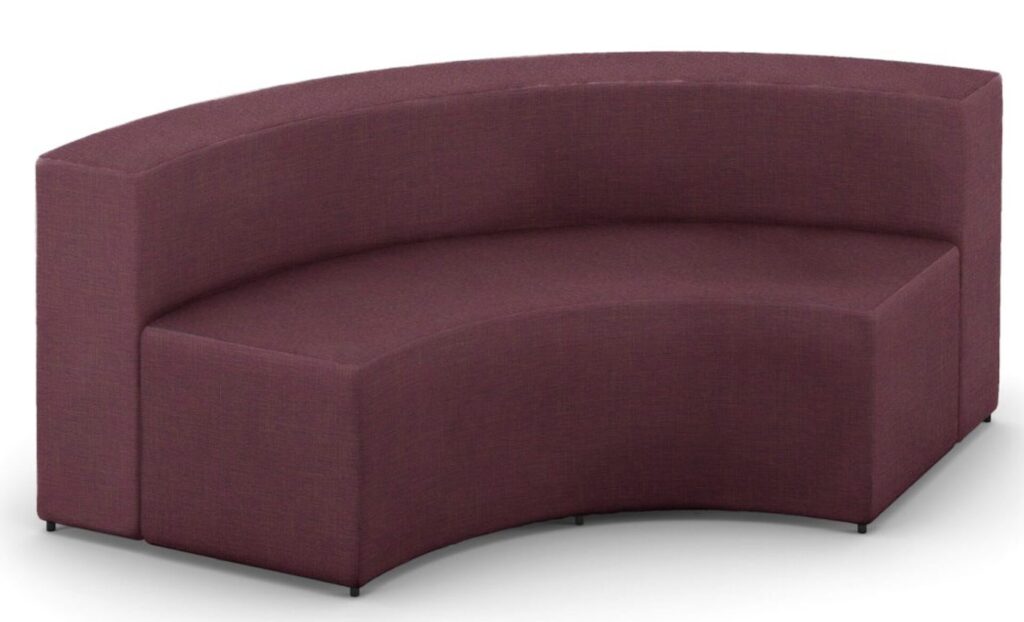
As mentioned earlier, Stinson and Arc-Com combined present a significantly more formidable presence then either alone. With avg. product spec shares of .10% and .09% respectively, they each have contenders within their portfolio. Stinson’s top-product, Flanders (tied at #19 with a .25% spec share) traffics familiar terrain as a versatile performer. Here it is on The Flex Lounge by HPFi.
Stinson’s Flanders. A reliable contributor, but is that enough?
As mentioned earlier, Stinson and Arc-Com don’t mirror the profile of the market’s leading players — they lack both the scale and the top-end impact that define brands like Maharam and Designtex—but as a combined entity, they begin to complement each other’s limitations. Stinson brings a focused lineup with a handful of credible performers but lacks breadth. Arc-Com offers broader reach, with a large portfolio of widely specified products, but similarly falls short of delivering standout performers.
We asked designer Heather Groff of Mancini for the human version of ChatGPT’s breakdown. Not surprisingly, she concurred with AI’s take on Maharam (absent any prompting or knowledge of this article): “Maharam is first in terms of looks alone,” she said, “but can be difficult to use in a commercial setting.” That leaves the door open for more pragmatic contract textile brands—Groff cited Carnegie as “best overall,” Momentum as “a great one for graded in,” and described Arc-Com as offering “affordability and the occasional sleeper hit.”
A Familiar Pattern Emerges
But there’s an intangible here that may speak to the challenges faced by Stinson—and now perhaps Arc-Com—in climbing toward the top ranks. In the image below on the left, the geometric swatch “Flip FIP18” bears a noticeable resemblance to Carnegie’s highly recognized, older pattern “Maxwell” (on the right), which happens to be the 53rd most specified textile product, with a spec share of 0.18%. Notably, Flip FIP18 doesn’t appear among the top 500 at all.
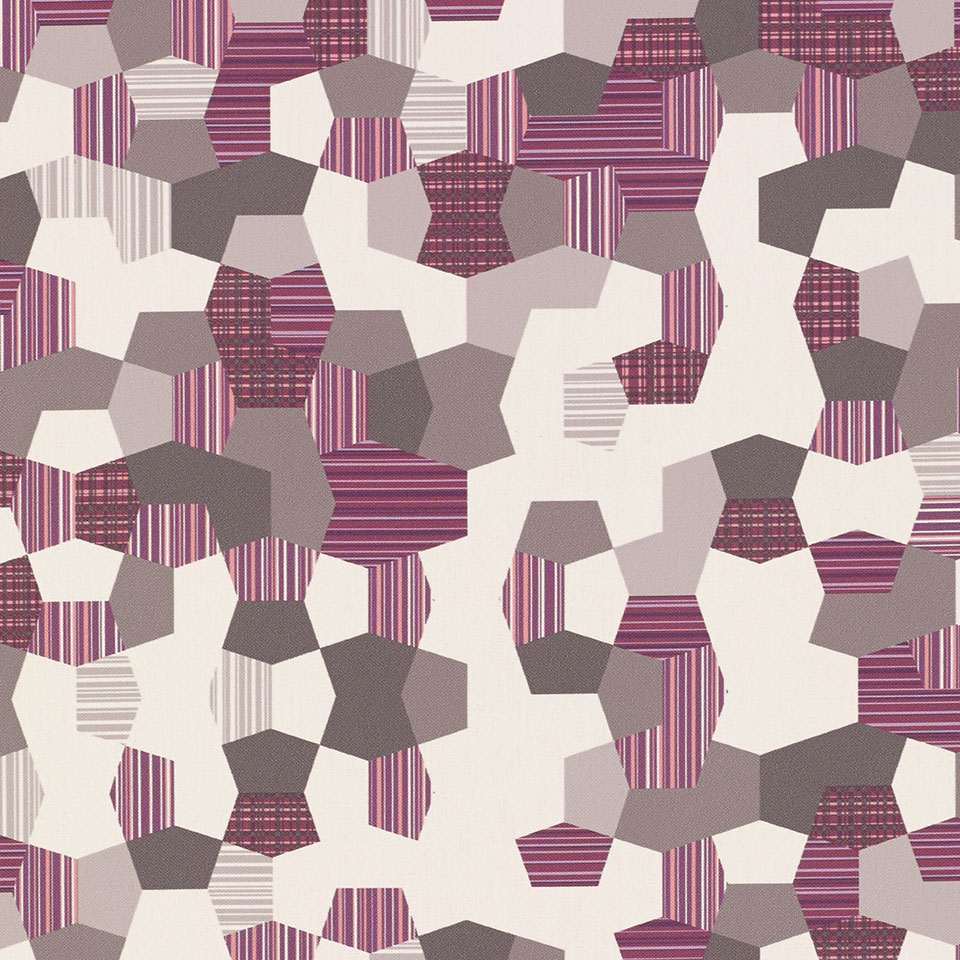
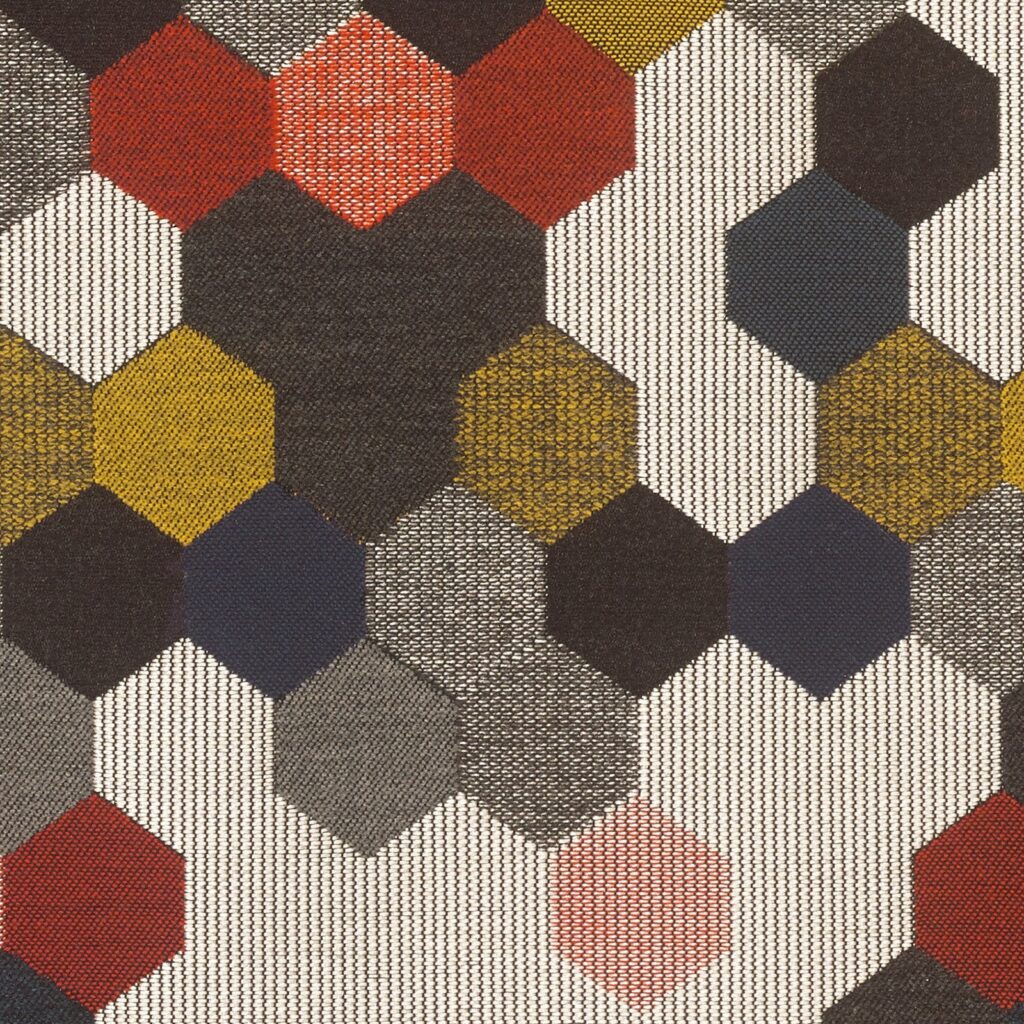
It’s certainly possible the resemblance is coincidental. Other leading textile brands have patterns that evoke a similar vibe—after all, you can’t trademark a geometric print. But most in the industry would concur that neither Stinson nor Arc-Com is a leading force in terms of innovative design. The prevailing perception is that both companies are following trends, not defining them.
“Maharam is first in terms of looks alone.”
Heather Groff
Mancini, Senior Designer
The Spec Sheet Can’t Tell you who’s Cool
Much of this comes down to reputation/marketing, but neither Stinson nor Arc-Com have the allure and overall brand presence of either Maharam, or Designtex, or Luum, or Momentum, for that matter. The perception hinted at in the above quote is manifest in the absence of campaigns centered around star designers. To wit: Maharam has Hella Jongerius; Designtex has Sophie Smallhorn; Luum’s portfolio is fairly built around Suzanne Tick; and Momentum’s Elie Moser authored the dazzling Idyllwild, this year’s Best of NeoCon silver winner for upholstery textiles (below left). True, Stinson won gold in the same category for “The Collective” (below right), yet which of these makes more of an impression?

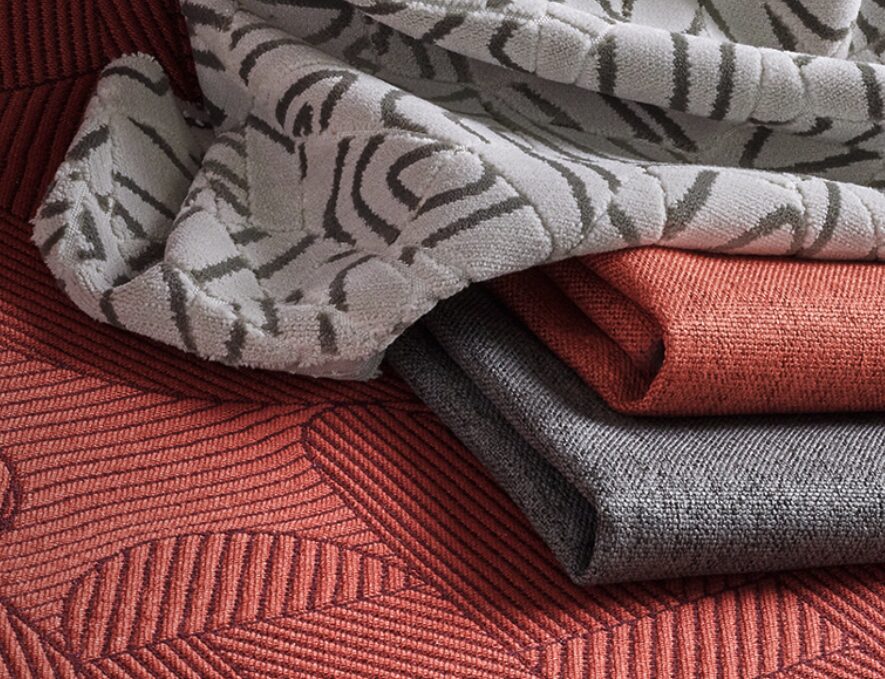
Lest we get too far off-track, the important point is that Maharam and Designtex aren’t at the top via spec performance alone. Or, better said, specs don’t accumulate in a vacuum. They’re rather a confluence of manufacturer reputation, brand presence, product quality, and sales rep relationships. The “design and dazzle” quotient is also arguably quite important.
Stronger Together, but Still in Maharam’s Rear View
Looking at all of these factors together within the context of the data helps chart a course for the new Stinson/Arc-Com: They’ve built a stronger, deeper presence than either could claim alone, enough to vault them past Momentum in product count and average rank. Yet despite this improved competitive position, they still trail the market leaders. The challenge now is turning that stronger, increasingly agile platform into market leadership, a leap that will require more than just combining portfolios. In a market where success demands both breadth and hits, the acquisition gives Stinson/Arc-Com a credible foothold, but moving into the top tier will require a step-change in both product strategy and market execution.
For now, they’ve earned a seat at the table—but leading the conversation will take more than just showing up.
Contextual Summary
This data reflects activity from designers using Designer Pages PRO to create and manage product specifications for their projects. Geographic distribution is based on where the designers are located, not necessarily where the projects themselves are taking place.
Viewed by region, the Northeast leads with 37.15% of total entries — driven by Massachusetts (16.85%) and New York (16.16%), along with additional contributions from New Jersey, Pennsylvania, and Connecticut. The South follows with 33.86%, powered by Texas’ commanding 25.82%, alongside Georgia (5.54%) and smaller shares from Florida, Maryland, Tennessee, and Louisiana. The Midwest contributes 14.74%, thanks largely to Michigan (8.04%) and Illinois (3.72%). The West rounds out the set with 9.36%, led by California (2.84%) and Nebraska (2.58%), plus smaller contributions from Colorado, Washington, and Arizona.
On the segment side, Workplace dominates at 38.69%, followed by Health & Wellness (21.77%), and Education (18.63%) — together comprising nearly 80% of all activity. Hotels & Restaurants adds another 13.66%, while the remaining six categories collectively represent less than 8%. It’s a clear signal that textiles are still making the biggest impact where durability, code compliance, and high-traffic resilience intersect — in spaces where performance isn’t a bonus, it’s a requirement.
*Data in this article does not include wallcoverings, which appears in Designer Pages PRO as a separate category.
Ready to spec what you see? Try Designer Pages PRO free for 30 days.
Related Posts


Leave a Reply